Instructions for the Project : Complete the missing links in the Carbon Cycle Diagram:
______________________________________________________
The Carbon cycle plays an important part in the existence of humanity and the Earth’s biosphere.
Carbon is constantly being exchanged between the ocean, atmosphere and land which I will now refer to as the “Carbon-cycle”.
The main source of carbon (CO2) is generated by the ocean as well as sedimentary rocks which can be found in vast quantities in places such as the Grand Canyon.
When carbon comes into contact with water, it forms and solidifies into calcium carbonate. This is when corals, algae and limestone reefs (that are rich in carbon) are formed thus continuing the cycle of additional respiration.
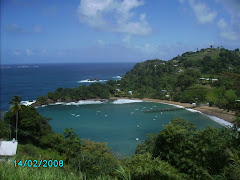
An excellent example of this resource that is rich in quantity is the world-renowned coral reef of Tobago called the “Buccoo Reef” (see Appendix 1 ).
Whether it’s on land or in water, plants use carbon dioxide in the photosynthesis process to produce, starches, sugars and carbohydrates.
Carbon is also released into the atmosphere when plants and animals decompose or the remains are extracted from the soil and used by plants or consumed by animals.
Unfortunately, due to the excessive burning of fossil fuels such as coal, oil and other raw materials, disproportionate amounts of carbon dioxide is being released back into the air. The repercussion is “global warming” and in turn temperature changes. Global warming is caused when fossil fuels are burnt at such a high rate, it outruns the natural progression of photosynthesis which naturally absorbs CO2 from the biosphere.
Upon perusal of the “Science Daily” website it was discussed that because of the increase in carbon dioxide in the earth’s atmosphere (through fossil fuel emissions) it is having a huge impact on the ocean as well.
For example, it has been discovered that because of the high volume of CO2, the ocean acidifies (a decrease in the PH balance) therefore causing a chemical imbalance which is threatening to all shell organisms and the life of corals and skeletons.
In a published study done by the Coral Cay Conservation and Buccoo Reef Trust (of Trinidad and Tobago), it was implied that because of increased ocean temperatures (due to excessive CO2 in the atmosphere ), coral “bleaching” is occurring. This means that there is a loss of extremely large quantities of algae, leaving the host (coral) to appear paler or very white thus loosing its radiance and color.
In conclusion, if we do not find a way to re-use and harmonize our needs and wants with raw materials and natural resources, then I believe that inevitably the earth and all that exists within it will disintegrate and become scarce and possibly non-existant.
I have therefore attached my own creation and interpretation of the carbon cycle diagram (and its effects) so that we can all have a clear yet simple understanding on the effect that we as human beings are having on the environment.
I also await hope and see possibilities that industries and we as individuals, as human beings, can make everyday conscious decisions to respect and make positive change toward the conservation of biodiversity.
CLICK ON IMAGE TO SEE FULL VIEW OF CARBON CYCLE DIAGRAM
______________________________________________________
The Carbon cycle plays an important part in the existence of humanity and the Earth’s biosphere.
Carbon is constantly being exchanged between the ocean, atmosphere and land which I will now refer to as the “Carbon-cycle”.
The main source of carbon (CO2) is generated by the ocean as well as sedimentary rocks which can be found in vast quantities in places such as the Grand Canyon.
When carbon comes into contact with water, it forms and solidifies into calcium carbonate. This is when corals, algae and limestone reefs (that are rich in carbon) are formed thus continuing the cycle of additional respiration.
An excellent example of this resource that is rich in quantity is the world-renowned coral reef of Tobago called the “Buccoo Reef” (see Appendix 1 ).
Whether it’s on land or in water, plants use carbon dioxide in the photosynthesis process to produce, starches, sugars and carbohydrates.
Carbon is also released into the atmosphere when plants and animals decompose or the remains are extracted from the soil and used by plants or consumed by animals.
Unfortunately, due to the excessive burning of fossil fuels such as coal, oil and other raw materials, disproportionate amounts of carbon dioxide is being released back into the air. The repercussion is “global warming” and in turn temperature changes. Global warming is caused when fossil fuels are burnt at such a high rate, it outruns the natural progression of photosynthesis which naturally absorbs CO2 from the biosphere.
Upon perusal of the “Science Daily” website it was discussed that because of the increase in carbon dioxide in the earth’s atmosphere (through fossil fuel emissions) it is having a huge impact on the ocean as well.
For example, it has been discovered that because of the high volume of CO2, the ocean acidifies (a decrease in the PH balance) therefore causing a chemical imbalance which is threatening to all shell organisms and the life of corals and skeletons.
In a published study done by the Coral Cay Conservation and Buccoo Reef Trust (of Trinidad and Tobago), it was implied that because of increased ocean temperatures (due to excessive CO2 in the atmosphere ), coral “bleaching” is occurring. This means that there is a loss of extremely large quantities of algae, leaving the host (coral) to appear paler or very white thus loosing its radiance and color.
In conclusion, if we do not find a way to re-use and harmonize our needs and wants with raw materials and natural resources, then I believe that inevitably the earth and all that exists within it will disintegrate and become scarce and possibly non-existant.
I have therefore attached my own creation and interpretation of the carbon cycle diagram (and its effects) so that we can all have a clear yet simple understanding on the effect that we as human beings are having on the environment.
I also await hope and see possibilities that industries and we as individuals, as human beings, can make everyday conscious decisions to respect and make positive change toward the conservation of biodiversity.
CLICK ON IMAGE TO SEE FULL VIEW OF CARBON CYCLE DIAGRAM

Appendix 1: THE BUCCOO REEF IN TOBAGO
Referenced Websites
http://www.bobspixels.com/kaibab.org/geology/gc_geol.htm.
http://www.buccooreef.org/Coral_Bleaching_Report_1.pdf
http://www.carboncyclescience.gov/about.php#Introduction
http://www.sciencedaily.com/releases/2007/03/070322110240.htm
http://www.sciencedaily.com/releases/2006/02/060220231628.htm
http://en.wikipedia.org/wiki/Calcium_carbonate
http://en.wikipedia.org/wiki/Carbon_cycle
http://www.teachersdomain.org/resource/tdc02.sci.ess.earthsys.ccycle/
http://www.youtube.com/watch?v=tcGoWD6m5Wk&NR=1
Referenced Photographs
http://www.aerospaceguide.net/solar_system/our_sun.gif
http://www.cbd.int/cms/ui/photos/photo.aspx?id=363&width=500&height=800
http://www.enterstageright.com/archive/articles/0408/033108ocean.jpg
http://www.fossilmuseum.net/fossilrecord/images/erosion.jpg
http://www.gujaratindia.com/images/wildlife%201.jpg
http://www.hikingtripreports.com/images/grand-canyon.jpg
http://www.haliburtonforest.com/images/bkgd/main1a.jpg
http://hvo.wr.usgs.gov/volcanowatch/2005/images/ozone-pollution-smog.jpg
http://images.google.com/images?gbv=2&hl=en&q=forest+and+wildlife
http://media-2.web.britannica.com/eb-media/41/91641-004-842864B7.jpg
http://ourpreciouslambs.files.wordpress.com/2007/07/earths-atmosphere.jpg
http://www.surfinside.com/Pic's%20Link/pictures/2004/8-04/Costa-vegetation/vegetation.jpg
Bibliography
Environmental Studies, Barry Barker, Second Edition


6 comments:
HELLO,
I THINK THIS IS GOOD !
Excellent job... love the video and the graphic. Was just enough info to keep me interested and make me want to know more. Keep up the good work!
Very informative blog...it makes me want to renew my efforts to go green. It's funny how even the little things we do affect the planet. Hopefully in the near future there will be earth-friendly alternatives to power our various modes of transportation.
Terrific work! I am inspired to continue my conservation efforts. Hopefully, the children of the next generation will have a cleaner planet on which to live.
another reason to protect our oceans, they are our CO2 Buffers!
I really like the diagram you created. This learning device breaks down the carbon cycle into a format the makes learning easy for individuals that aren’t in the sciences. This job is commendable because the breaking down and organization of such scientific data, is often done in a format that is overly convoluted and ambiguous. Two thumbs up!
Amarae`
Post a Comment